
Knowledge Graph
These are the knowledge graph best practices; we cover everything from consideration, to evaluation, to implementation, and to expansion of a knowledge graph environment. If you want to build a successful phase one knowledge graph, on time, on budget, with real ROI... this is a great place to start.

Building Knowledge Graph Momentum
Educating Others About Knowledge Graph and Getting Support for the Project
As a software company with decades of experience in knowledge graph technology and applications, we are sharing our knowledge and experience with others because we understand the need is great and will affect positive outcomes for data management and decision making.
Just as we are creating awareness and educating readers about knowledge graph technology, a person seeking to promote adoption in their organization should do likewise. But a prerequisite is to understand the concepts yourself. A great resource for this is, again, the ebook. After you arm yourself with a good grasp of the concepts, their capabilities and how knowledge graph changes the data management paradigm, you are in a better position to educate and inform others.
When you develop your message, perhaps start by focusing on why knowledge graph technology is important. There is a dynamic in virtually every data rich organization that features a use case driven approach to data collection and preparation and consumption. If you understand knowledge graph technology, you know the movement seeks to shift from an application-centric (i.e., use case-driven) approach to treating data as a product (i.e., data centricity).
In the application-centric approach so dominant today, we apply (too much) human capital to transactional workflows. Meaning users, and certainly developers, spend a lot of time wrangling data to “fit” applications. This is a waste. If you communicate to users, solution architects and developers how life will be different using the knowledge graph approach, they should want it. For example, executives want to “know what they know,” and they want it from a single “pane of glass.” Moreover, leaders want to know, “what’s next”? Knowledge graph technology is the critical enabler.
Since the knowledge graph integrates potentially all your data sources, you now have a way to deliver information in one “place.” You also have a way to allow users to pivot around all content and ask ad hoc questions. Perhaps subtle, you also can deliver information that is based on the concepts they care about (i.e., how users think), as opposed to delivering data based on schemas and data types.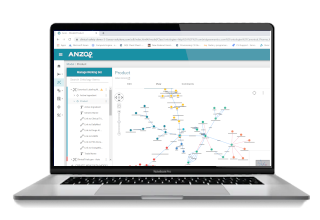
If Digital Transformation is a key objective of your organization, knowledge graph will play a vital role. While we commonly discuss consumption of knowledge graphs from a human perspective, this technology is ultimately intended to serve automated clients and processes. Specifically, W3C RDF and W3C OWL are envisioned to create a means to enable sophisticated machine-to-machine interactions; and that is where this is going.
After you develop your message for “why knowledge graph,” you want to explain clearly and accurately what knowledge graph technology is. Arguably, a knowledge graph consists of “knowledge” and “graph.” The graph part is RDF, and it represents the way to structure and convey data. The knowledge part is OWL, and it provides the mechanism to represent meaning; that is, what things are and how the things relate to each other.
The combination results in schema-less and self-describing data that is easily consumable and understandable by humans and machines. After all, we are largely in the current predicament because we didn’t factor such ideas into our early database systems or our file formats. We didn’t necessarily consider that others would want to use “our” data or that our data was related to others’ data. The knowledge graph explicitly assumes that data from different sources is related and that others may want to consume it.
Required Knowledge Graph Roles & Skills
If new skills and roles are required to adopt knowledge graph technology, the barrier to adoption might be too great. A good implementation abstracts the technical details, but still allows those savvy in graph operations to interact with the “raw” knowledge graph.
With effective abstraction, tooling, workflows and APIs, your knowledge graph solution is accessible, manageable and sustainable by contemporary users and developers. There is no need for new roles or skills.
 When you assemble your team, focus on existing personnel and how they can support the knowledge graph paradigm. Depending on your implementation, roles such as Database Administrators will find that life is easier. Users and developers are more empowered, which reduces the burden on traditional Database Administrators.
Knowledge graphs built on RDF and OWL are resource-oriented, which means they lend themselves well to RESTful services architecture. In fact, the implementation should, or at least could, be a self-similar design, which means the software system that manages the knowledge graph is also built on RDF and OWL. This promotes high cohesion and consistency.
Trust and Confidence in Knowledge Graph Data
A new function arises from semantically integrated data: verification and validation. When multi-source data is used to create a knowledge graph, users and automated clients access information that is combined from potentially many sources. A decision maker cannot or will not simply act on this information unless he or she has confidence. And that confidence is enabled through verification and validation. In other words, your implementation needs to provide provenance for every field or property of data.
If you think about it, we can employ the current roles and skills to create and manage knowledge graphs; however, we are “inverting” the data access model from a “bottom up” process to a “top down” process. Yes, it’s true that we construct the knowledge graph from data sources, but that’s a necessity born from legacy approaches to data management. In the future, data will align directly to knowledge models and will inform decision makers and other consumers from an information view. The “data view” will support findings and conclusions. And don’t forget! The knowledge graph paradigm is ultimately for increasingly autonomous systems, which implies that humans have an important role in verification and validation. The “garbage in, garbage out” principle still applies.
Knowledge Graph Preparation
Ironically, the biggest challenge you might face to getting a knowledge graph project underway is getting access to the source data! This is more common than one might think, and it reveals an interesting truth. People know intuitively that data is valuable, and its value creates interesting dynamics. This is partly why we say culture can be more important than technology. So when preparing your project, ensure that you have access to the data sources you need.
To implement, demonstrate and manage your knowledge graph, you need appropriate software. While it is true that one can encode a knowledge graph using a text editor, that would be tantamount to boiling the ocean. A number of commercial and open source software solutions are available. Open source software tends to be more developer-oriented, and commercial software tends to be more abstracted, scalable and maintainable. You basically are going to pay people to develop your knowledge graph solution, or pay a license to those who have already developed a solution platform. We're biased, but we recommend the latter.
Why? Knowledge graph is something of a paradigm shift for data. As such, your risk is considerably higher than continuing the status quo. Engaging with a commercial company provides you access to grizzled veterans who understand deeply the tactics, techniques and best practices. They share a mutual interest in your success. The use of a commercial solution platform will allow you to focus on rapid time to value and business outcomes.
Know what you want to show end users and stakeholders
Our experience is that technical audiences appreciate the strategic value more than users or executives. So they can be an ally or an obstacle. From experience, it seems like end users and decision makers should be the primary targets.
Think about the user interfaces you plan to show. Displaying dense graphs of nodes and edges — fuzzballs — is not going to win the audience. A simple tabular display of semantically integrated data from multiple sources can be more effective. From various columns in the table, provide links that drill into related information. This simple approach can be powerful for people who spend a lot of time querying multiple systems, aggregating data from those systems, and then organizing the data for use. It quite literally displays multi-source data in one view.
Also prepare traditional charts and graphs. Bar charts, line charts, bubble diagrams, heat maps, etc are familiar and relatively easy to understand. Your challenge is to show how easy it is to feed those views from multiple sources. Remember, knowledge graphs are about processing data and they enable more effective and efficient analysis.
Another aspect of your demo should highlight relational navigation. You might call these filters. Your demo should provide multiple views along with user-configurable filters that allow them to rapidly select and narrow down displayed information. These are essentially highly parameterized questions.
To be sure, users and developers will say things like, “We already have filters.” True, but a good knowledge graph application will dynamically create filters from the knowledge graph. In other words, the filters come from the data, not prebuilt application-specific rules. This creates a new capability for users (and automated clients) to easily ask unanticipated questions! This capability further empowers end users to be more self-sufficient.
Think about things like hypothesis testing or discovery. Knowledge graphs allow users to ask questions of the entire knowledge graph and in arbitrary combinations. This is new.
What are common reasons for project delays in your organization?
Popular next steps are circulating the O’Reilly Knowledge Graph Ebook and demoing our knowledge graph platform Anzo.
If you’d like to speak to one of our knowledge graph experts, simply fill out the form on this Anzo demo web page and we will do our very best to hold your hand through your knowledge graph journey.

